
The Danish Road Directorate's noise measurements by motorway E45 show a strong correlation between measured and calculated levels. At the same time, the results have provided increased insight into variations in noise over time.
What is the difference between calculating and measuring noise?
The noise level from roads can either be measured directly or calculated. Calculations provide an accurate overview of the average noise exposure over a year (Lden), while measurements show fluctuations over shorter periods.
Internationally, the annual average is recognised and used as a good indicator of the degree of annoyance people experience at different noise levels, and as an indicator of health effects caused by noise. Therefore, in Denmark—as well as internationally—limit values have been set that refer to the annual average noise level, also called Lden (see Fact box 1).
In Denmark, the Environmental Protection Agency has set a recommended noise limit of 58 dB (Lden) for noise at residential buildings planned near roads. In Denmark, we use the common Nordic calculation method Nord2000 to calculate noise. It is one of the most advanced noise calculation models in the world.
Internationally, noise calculations are used to account for road noise. Noise calculations can provide a good and accurate overview of the long-term (annual average) noise impact in larger areas. The calculated noise level is used in a number of contexts, including noise mapping for road projects.
The Danish Road Directorate is often asked to perform noise measurements, partly due to less confidence in calculated values. This is partly because measured instantaneous values naturally differ from a calculated annual average, and partly because it is difficult to explain and understand the significance of an average noise level over a year.
This is part of the background for why the Road Directorate initiated long-term noise measurements along the E45 motorway in connection with the road expansion.
The noise indicator, Lden
Lden stands for Day-Evening-Night Level and is used in most countries to indicate noise exposure from traffic (roads, railways, airports, and airfields).
When calculating Lden, noise occurring in the evening is weighted 5 dB higher than noise during the daytime. Noise occurring at night is weighted 10 dB higher than during the day.
The data basis for Lden consists of annual average traffic and meteorological data.
Weather classes
Weather conditions are characterised by 9 different weather classes, of which the most common are named M8, M13, M18, and M24. According to ISO 1996-2 (2017), these four weather classes include the following conditions:
Weather class | Propagation | Characteristic | ||||
|---|---|---|---|---|---|---|
M24 | Very | Strong | ||||
M18 | Favourable | Weak tailwind | ||||
M13 | Neutral | No wind | ||||
M8 | Unfavourable | Headwind |
"Tailwind" means that the wind is blowing from the road towards the measurement position.
Main results of the study
The study of noise from the E45 motorway documents the results of the first series of long-term noise measurements conducted in Denmark according to the international standard ISO 1996-2 from 2017. The standard stipulates, among other things, how measurements are best carried out to obtain a reliable estimate of the annual average noise level.
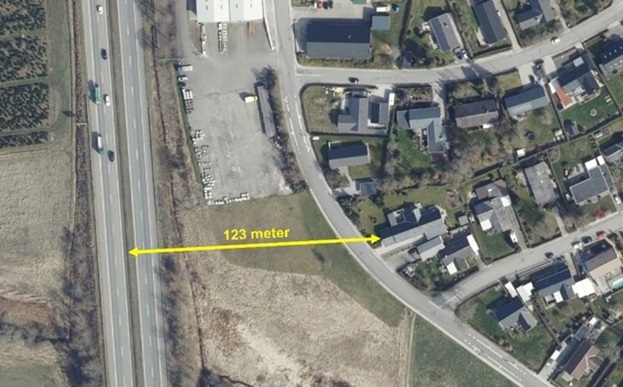
The noise measurements were conducted at various neighboring houses along the E45 motorway between Randers and Vejle.
The measurements at each location were performed over two periods of about 2 months each, in summer and autumn, respectively. The periods were chosen to maximize the likelihood of including the weather types most crucial for noise over a representative year (see Fact Box 2 on weather classes). This provides the least uncertainty in measurements when assessed as an annual average.
Especially wind conditions, in terms of strength and direction, have great significance for the propagation of noise from the road, but temperature gradients also affect sound propagation. In addition to wind direction, the temperature gradient (the temperature difference between 0.5 and 10 metres above the ground) also influences how well noise spreads. A positive temperature gradient (colder near the ground than higher up) results in good sound propagation and corresponds to a tailwind situation.
Simultaneously, calculations of Lden were conducted at the selected monitoring locations and compared with Lden values determined from the measurement results.
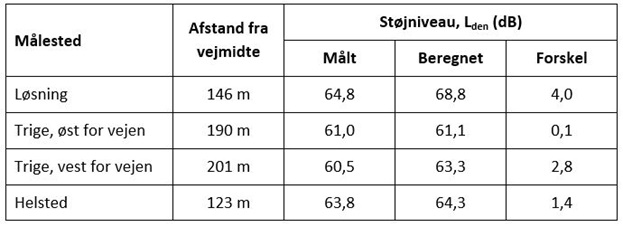
The study generally showed good agreement between measured and calculated noise levels. At Trige East, the difference was just 0.1 dB, while the largest deviation was 4.0 dB at Løsning. In all cases, the calculated values were slightly higher than the measured ones.
How much does the noise vary?
Figure 2 shows a selection of the measurements from autumn in Helsted for the whole of week 43 in 2019, where various meteorological conditions influenced the measured noise levels.
The figure, with a thin black line, shows how mean values per hour (LAeq, 1 hour) fluctuate. The upper part of the figure (the green curve) shows the measured meteorological class hour by hour together with the measured noise levels at the measuring station. The weekly measured mean value is shown with a thick black line, and the corresponding value of Lden is shown with a light blue line. For comparison, the calculated value of Lden based on the official annual average of meteorological conditions (pink line) is also plotted.
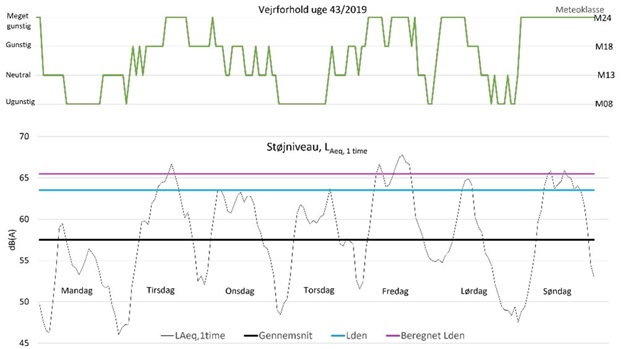
By examining the curves, it is clear there is a rhythmic variation over the day and week, partly related to traffic changes (rush hour, few cars at night, etc.). However, they also show that the noise levels at neighbors vary for other reasons. Monday features mostly headwind (poor sound propagation from road to measurement station). Tuesday and Friday see mainly tailwind (favorable propagation) from the road to the location. Here, the daily mean noise is 6–7 dB higher than on Monday.
It is also clear that the lowest hourly values at night occur during headwind (unfavorable propagation). Here, the variation is even greater – from around 46 dB (during the nights to Monday, Tuesday, and partly Sunday) to 55 dB on the night to Saturday, when there is tailwind, i.e., favorable sound propagation.
Table 2 shows the variations in the measured mean values across the daytime, evening, and night periods, as well as for the whole day (without evening and night weighting).
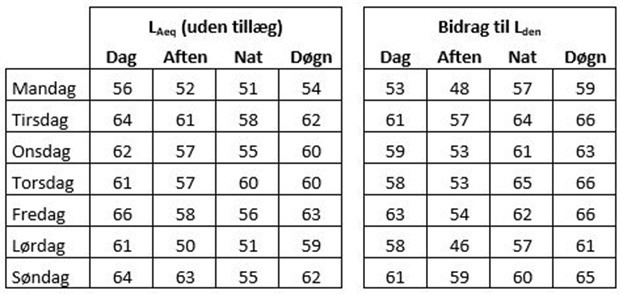
On the left side of Table 2, it can be seen that LAeq varies by more than 9 dB between Monday and Friday, with a 10 dB daily difference. In the evening, noise varies hourly by up to 11 dB from Monday to Sunday, and at night, there are variations up to 9 dB between Monday and Thursday.
On the right side of the table, an Lden value for the specific day is calculated, and the individual contributions from the day, evening, and night periods are shown. The impact of the 5 dB and 10 dB weightings for the evening and night periods is evident, as the night period generally becomes dominant in the total noise burden Lden. This observation applies to all measurements conducted in the project.
Instantaneous values may vary
Long-term measurements do not allow for comparison of instantaneous or peak values measured as LAmax. Therefore, supervised measurements were performed at each monitoring location over two hours in the day and at night, both in summer and autumn.
Some of these variations are shown and discussed in a previous article in Trafik & Veje (March 2021).
Correlation between measurements and calculations, but with uncertainties
In most measuring positions, the measurements generally showed good correlation with the calculated levels. However, it is extremely difficult to ensure that errors do not occur during unattended measurements. For example, one monitoring location showed a sudden drop of 8 dB in noise levels without any apparent traffic or meteorological causes. We have not been able to find well-grounded explanations and assume it was due to an instrument fault. Thus, these measurements were discarded.
Another important experience is that similar measurements should aim to select measuring locations where the sound propagation path is as simple as possible. Some locations used were in partial “shadow positions” due to terrain, or on facades without a full view of the road. This introduces uncertainties for the calculations to which the measurement results are compared.
It is characteristic of the completed measurements that measured Lden values generally lie lower than the calculated values.
Valuable experiences
The study has provided new knowledge about how motorway noise varies over time. It confirms that calculations are reliable but also shows that weather and traffic changes have significant influence. This knowledge can support more precise noise assessments in the future.
The article is based on: J. Kragh, C. Backalarz, and P. Finne, 2021: “Experiences from long-term measurements of noise from the E45 motorway”, Force Technology, Technical Note TC-101703, 15 June 2021.


Reach out to for more information.